The power of geospatial analysis lies in the new ways it provides to look at datasets and the relations among them. It allows you to explore more nuanced questions and discover correlations previously hidden. Used properly, geographic information system (GIS) tools can increase the saliency of a policy issue by expressing your argument visually and often much more effectively. Below is my recent experience in using GIS tools to broaden the audience for my research.
Property Assessment Disparities
Municipalities across the country are under fiscal duress due to cuts in state/federal aid, property tax levy limits, and rising employee fringe benefit costs. Often limited in their ability to generate new revenue streams, municipalities have become overly dependent on property taxes to “keep the lights on”.
Taxes are always a contentious issue and nobody wants to pay more than their fair share. To get a sense of how equitable the property tax burden was in Milwaukee, a city wrestling with all of the challenges noted above, I analyzed 33,000 property sales transactions over a 10-year period and compared them with their corresponding assessment values. By regressing the assessment value/sales price ratio on a host of predictors including building condition, lot size, geographic location, etc., I was able to get a sense of how equitable the city’s property taxation system is. While the findings presented an interesting disparity in who was paying their fair share, the results were neither accessible to the average citizen nor actionable for the policy maker. They required an understanding of my model specification and an ability to interpret coefficients expressed in terms of log odds.
Before I discuss how geospatial analysis broadened the audience for my research let us briefly digress into what property assessments are and why we should care about them.
What Are Property Assessments and Why Should We Care?
Property assessments are a key determinant in your property taxes; the higher the assessment, the higher the tax bill. While your assessment is a function of many factors, including lot size and property condition, the single largest determinant is market value. Your property assessment should reflect the price you could sell it for in an arm’s length market transaction.
The Insights of Geospatial Analysis
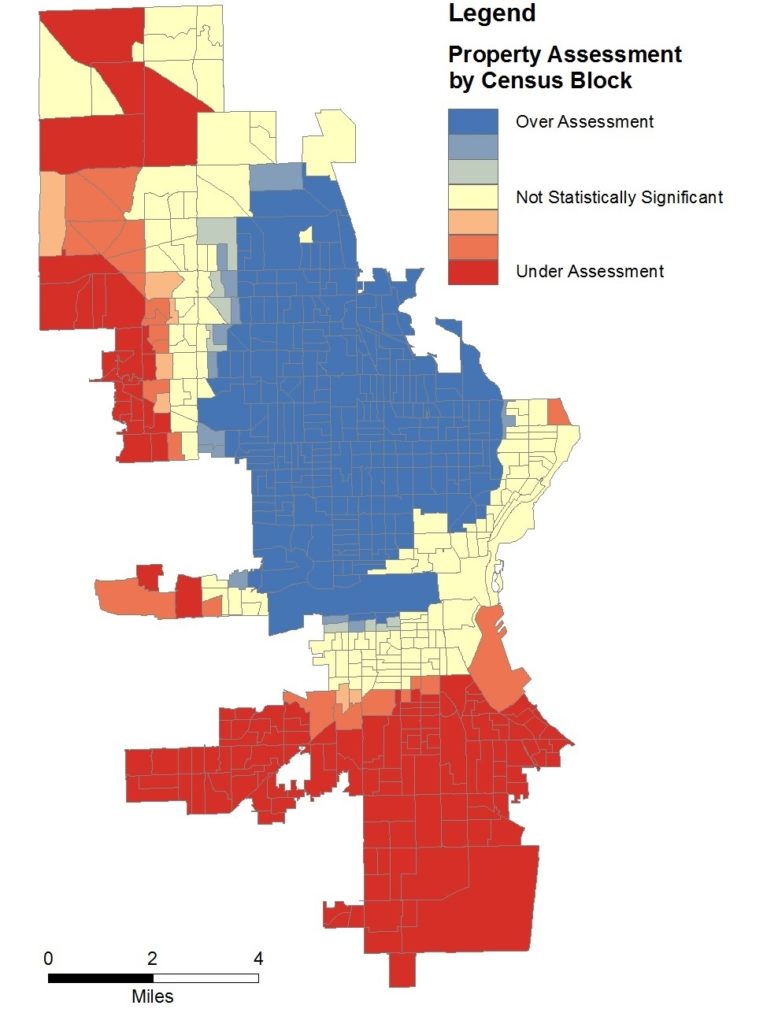
Utilizing GIS tools changed the nature of the questions I could explore within my dataset. I was now able to investigate additional questions related to geographic patterns in the results. To the right is a heat map analysis of property assessment disparities aggregated at the census block group level.
The geographic clustering is remarkable. It is clear that segments of the city are paying more in taxes than the value of their property suggests while others are paying less.
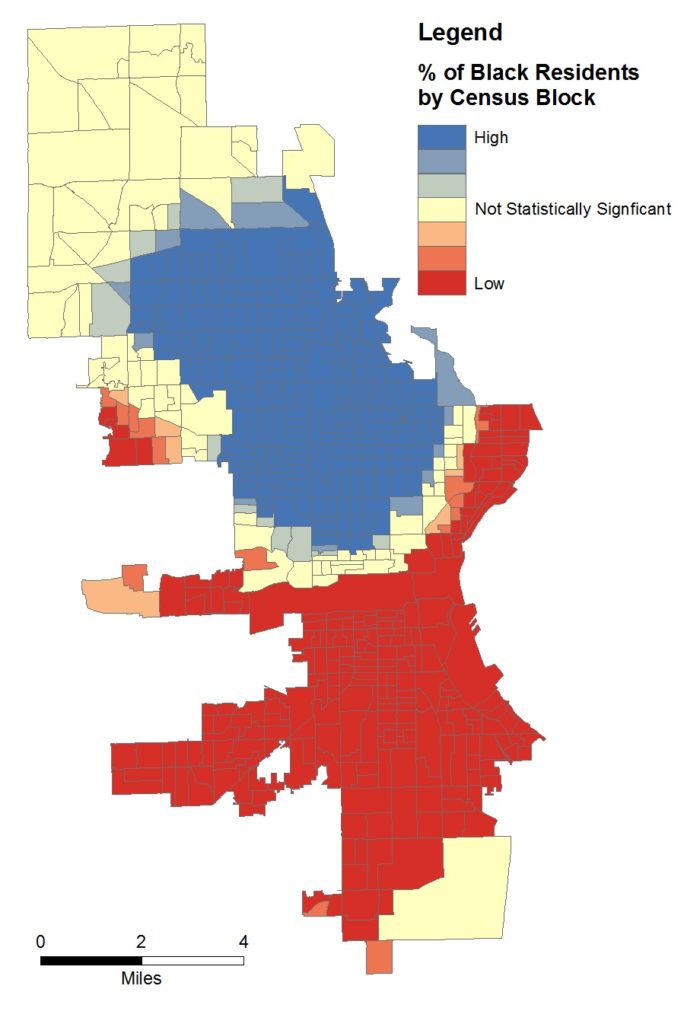
Curious about how this distribution compared with other salient attributes, I created additional heat maps of median income and % of black residents below.
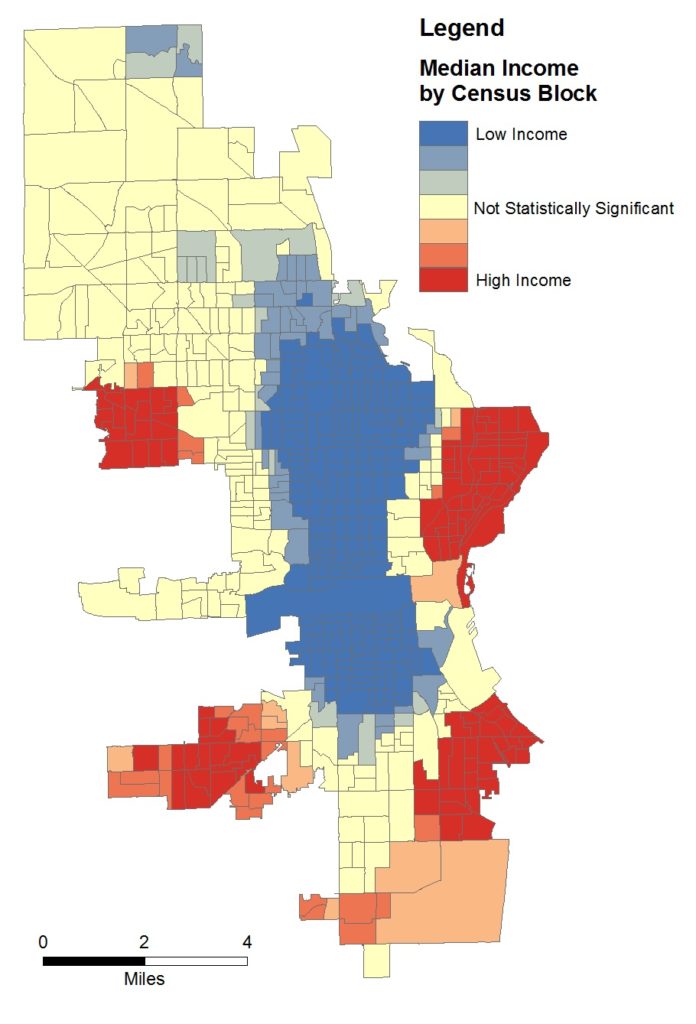
Given the complexity and cost of fighting property tax assessments, the correlation with income is not surprising. The findings suggest that providing technical help for low-income homeowners interested in contesting their assessments may be one approach to combat the observed disparities.
As I have reached out to interested parties across the country regarding my findings, I cannot overstate the effectiveness of presenting the results in a geospatial context in generating interest and facilitating conversations.
As governments across the country release more datasets as part of the open data movement and IoT technologies provide a litany of new metrics, it will become increasingly important that we analyze and present data in ways that are actionable and understandable to policy makers and citizens.
Fortunately for me, evaluating and assessing value based on a few more variables regarding the black population is very natural and easy for me to do. How I love the suggestive plots, I think it’s really more about what you’re trying to achieve with the properties. In general, the interest of most of them remains fairly similar depending on the area. Consider me fresh out of the box, I completely agree with what your saying with all the (GIS) and the mathematics…. I think I will resort to what you’re getting at Phil – (This is where it get’s real and I’m in a position to justify myself or defend anything I’ve said on a statistic basis. While looking at cute pictures expressing nothing. Now, you literally spouted a theory to provide for low income households with the tools to rob one another? Do you not realise with your genious minds and math skills all it takes is a good sales pitch of some distraction, or potentially actually what you’re promoting but that’s something I would hypothetically involve myself in. I don’t know you. I’m just that guy. – self
Could you *also* post scatter plots of income percentile vs assessment ratio and black population fraction vs assessment ratio? The heat maps shown are strongly suggestive, but to be credible decision-making supports, they ultimately require a more direct statistical presentation to support their conclusions.
A possible additional factor that should play a role in the presentation include the number of properties in each census block – there’s nothing about the census that ensures an equal distribution of properties. Visually, this could be directly accounted for by presenting a cartograph instead of a pure map.
Interesting diagrams. GIS and statistics sound great. Communicating with the black community is an easy thing for me to do if you are talking actual business with all the lingo, grammar, statistics and this wasn’t some waste of time in order to mock any specific idea. Anyhow, if you actually had a good idea of statistics which is pretty ridiculous to base an approach off of although I’ve never took the time with data sets….. It’s not a pure map. This is either mockery or a waste of time, maybe both. I’m a dear old in the box property so I have good answers…I just don’t see the interest in them.