This is the first part of a two-part series about a class project on online filter bubbles. In this post, we talk about our pedagogical approach and how we carried out the project. To read more about the results of the project, go to Part Two.
By Janet Xu and Matthew J. Salganik

The 2016 US presidential election dramatically increased public attention to online filter bubbles and their impacts on society. These online filter bubbles—roughly, personalized algorithms that over-expose people to information that is consistent with their prior beliefs—are interesting, important, and tricky to study. These three characteristics made online filter bubbles an ideal topic for our undergraduate social network class. In this post, we will describe a multi-week, student-led project on algorithmic filter bubbles that we ran with 130 students. We’ll describe what we did, how it worked, and what we’d do differently next time. You can read about what we learned from the results — which turned out to be pretty surprising — here.
In the spring of 2017, we taught an undergraduate class on social networks at Princeton University. The most important learning objectives for the course, which is targeted at sophomores and has no prerequisites, were to evaluate real, modern research and to begin to create new research. Given these learning objectives, we wanted the students to have the experience of actually doing new research, but this is difficult in a class with 130 students. Therefore, we decided to do one big group project. In fact, it turned out that by doing a group project we were able to do things that would have been impossible with individual projects. Thus, a large class turned out to be a feature, not just a bug. And the structure that we developed could easily scale to much larger classes.
As described at the beginning of the post, algorithmic filter bubbles seemed like an attractive focus of the project because they are interesting, important, and tricky to study. We considered a variety of algorithmic filter bubbles that could be studied, and we quickly settled on the Facebook News Feed because Facebook has more active users than any other online social networking platform, a majority of its users get news on that platform, it has been the subject of prior research, and it was easily accessible to all our students (they all had Facebook accounts).
What we did
The project—which we called Breaking Your Bubble—had three steps: measuring your bubble, breaking your bubble, and studying the effects.
In order to prepare students for the project, we introduced them to the ideas of filter bubbles, and we taught them about how the News Feed works. To make them sensitive to the methodological issues involved in participating in your own research, we also taught them about the trade-offs involved with self-experimentation. With this background—covered by these readings (1 and 2) and these slides (1 and 2)—students were ready to get started.
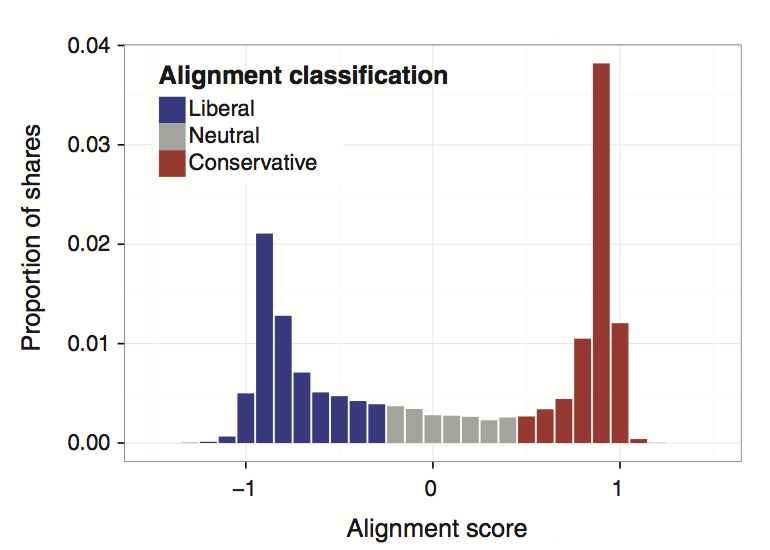
In the first step, students measured their filter bubble. More specifically, for homework, at three different time points each week, they scrolled through their feeds until they found five political posts (ads included). Then, they coded these posts as either liberal, neutral, or conservative. Students also kept track of how many posts they had to scroll through to get to five posts as a measure of how much political content was in their feed. All the data were uploaded through Google forms, and we used it to create a class aggregate, which you can see in this post.
In “precept” (that’s what we call discussion section), students discussed the challenges with doing these measurements. Of course, it turned out that people coded and counted things differently, which was exactly what we wanted them to experience. Then, the students speculated how “breaking your bubble” might actually change public opinion, and each precept came up with one survey question that operationalized an issue that they thought might be susceptible to attitudinal change. We compiled this into a survey that the entire class took as a pre-test measurement before breaking their bubble.
In the second step, the students developed and implemented a procedure to break their bubble. Their goal was to achieve a “balanced diet” of liberal, neutral, and conservative political content that matched the baseline distribution of what is being shared on Facebook as reported in Bakshy et al (2015).
Given this goal, as part of their homework, each student had to propose a procedure that could be followed by someone else in the class that would lead to a balanced diet. Then, in precept, students discussed these procedures and each precept settled on one procedure, but these procedures varied a lot form precept to precept. For example, they ranged from removing all “Liked” pages and targeted advertising preferences, to “hiding” posts from sources that aligned with one’s political orientation, to clicking on more cross-cutting stories. The most popular strategy—adopted to some extent by almost every precept—was to follow media outlets associated with the opposite party.
These strategies were implemented for three weeks, during which time the students continued to measure the content of their News Feeds. In order to keep students engaged during this time, we also had weekly data reviews and check-ins in precept. Finally, at the end of the semester, students took the attitudes survey again as post-test measurement.
Were students able to break their bubbles? See our results here.
How did students learn?
Did doing this kind of class project help students accomplish the learning objectives, which were to evaluate modern research and begin to create new research? We asked students to evaluate how the project helped them understand the theories and concepts introduced in class, how their overall experience was and what they learned, and if they would recommend the Breaking Your Bubble to students in the future. Nearly 90% of the students said that the project helped them understand the theories and concepts covered in class. However, only a third of the class thought that it contributed uniquely to their learning experience and a little more than half of the students thought that they didn’t need to alter their own Facebook News Feeds to understand filter bubbles (fair). About two-thirds of students recommended the project to future students. In open-ended evaluation questions, some students remarked that they would recommend the process of designing and conducting a scientific study together because that was interesting, but they did not like manipulating their own experiences as study participants. On the whole, students thought that they learned something about social scientific research by doing the project. Somewhat paradoxically, the experience seemed to increase both appreciation and skepticism towards social scientific research!
What we would do differently next time
Doing a project like this requires lots of trade-offs. For example, from a scientific perspective it would have been better if we randomly selected half the class to break their bubble and had half the class do nothing. But, this would have deprived half of the class from an important part of the learning experience. When faced with these trade-offs our general strategy was to discuss them with the students and be clear about why we were doing what we were doing. In general, we erred on the side of making this a good learning experience, at the expense of the scientific robustness of our findings.
One consistent piece of feedback we got from students was that the experiment didn’t run long enough. They surmised that attitude change takes time, and three weeks of exposure to cross-cutting content wasn’t enough.
Another piece of feedback was that the repeated measurements became tedious. It would have been easier for students to just read only the first 20 posts, rather than reading until they got to five political stories. Or we could have asked them to make the measurement once per week rather than three times. We also heard informally that some students might not have taken the data collection very seriously because it was tedious at times. This is something that we’d probably discuss with the students explicitly as part of the trade-offs in research.
Also, it might have been nice if each student could have received an individual-level estimate of the effect of their feed on them. This might be possible with an N-of-1 experimental design, but it would have require some kind of app to more finely control the students’ News Feeds (which would have introduced a variety of complications).
Finally, we didn’t get much chance to explore how people hand-coded each of their posts as “liberal,” “neutral,” or “conservative.” Many students pointed out that they themselves were biased towards finding more cross-cutting content over time. It would have been a nice addition to add some kind of inter-coder reliability study.
Conclusion
We set out to conduct a multi-week, group research project in a class with 130 undergraduate students. Overall, we are pretty happy with how it turned out. The students seemed to learn about the excitement, challenge, and occasional drudgery of social science research. And we all learned some things that we didn’t quite expect about the News Feed, which you can read about here!
Notes:
- We also did a mini-class project on the Google search algorithm. Here’s how it worked. In class, students proposed search terms that they thought would produce big differences when searched for by other members of the class. We wrote these suggestions on the board and then the students voted on six: marijuana, vaccination, Ferguson, MO, feminism, immigration crisis, and climate change. Then everyone in class searched for these terms and posted the results on Piazza (our online class discussion forum). At the beginning of the next class, I summarized the results, which is that the search results were not very different (slides). Then we speculated some about how this might have been different with a more diverse groups of searchers in terms of age and geographic location.
- Some of my (Matt’s) research has been funded by Facebook. This is on my CV, but we also explicitly disclosed this to the students, and we had a discussion about industry-funded research and conflicts of interest. I also pointed them to this article in the Intercept.
- We prepared an alternative assignment in case some students did not have a Facebook account. This alternative assignment was basically a time diary for people to record when and how they discussed political news with others. This way, students would still be able to construct similar measures about cross-cutting exposure and participate in class discussions. However, because every student had a Facebook account, we did not need to use the alternative assignment. If you do this for your class, you should consider how you can include students without Facebook accounts to make sure they don’t miss out on the learning experience.
- Thanks to the other teaching staff for helping us shape this activity: Romain Ferrali, Sarah Reibstein, Ryan Parsons, Ramina Sotoudeh, Herrissa Lamothe, and Sam Clovis.
The class had no prerequisites but the self-experimentation project assumes that each student is a member of an online social network. I’m curious you’ve come across a student who was interested enough in social networks to take the course but wasn’t actually part of any online social networks.
I find the filter bubble topic interesting, but I am not part of any online social networks that have an algorithmically curated feed. It seems this would make the project difficult to undertake.
It turned out that all of our students had Facebook accounts. However, we also designed an alternative activity that did not require Facebook in case some students did not want to participate. That alternative activity is described in the notes section at the bottom of the post.