Like many others who read this blog, I’ve spent some time over the last year trying to get more civic data online. I’ve argued that government’s failure to put machine-readable data online is the key roadblock that separates us from a world in which exciting, Web 2.0 style technologies enrich nearly every aspect of civic life. This is an empirical claim, and as more government data comes online, it is being tested.
Jay Nath is the “manager of innovation” for the City and County of San Francisco, working to put municipal data online and build a community of developers who can make the most of it. In a couple of recent blog posts, he has considered the empirical state of government data publishing efforts. Drawing on data from Washington DC, where officials led by then-city CTO Vivek Kundra have put a huge catalog of government data online, he analyzed usage statistics and found an 80/20 pattern of public use of online government data — enormous interest in crime statistics and 311-style service requests, but relatively little about housing code enforcement and almost none about city workers’ use of purchasing credit cards. Here’s the chart: he made (larger version)
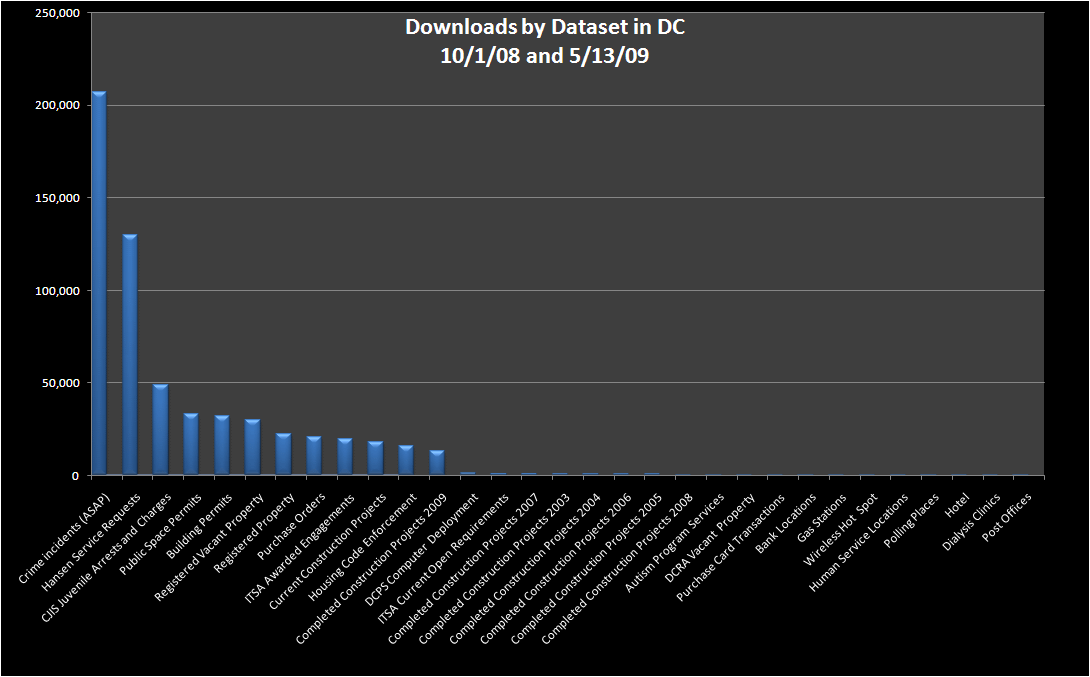
Note that this chart measures downloads, not traffic to downstream sites that may be reusing the data.
This analysis was part of a broader effort in San Francisco to begin measuring the return on investments in open government data. One simple measure, as many have remarked before, is foregone IT expenditures that are avoided when third party innovators make it unnecessary for government to provide certain services or make certain investments. But this misses what seems, intuitively, to be the lion’s share of the benefit: New value that didn’t exist before and is created by the extra functionality that third party innovators deliver, but government would not. Another approach is to measure government responsiveness before and after effectiveness data begin to be published. Unfortunately, such measures are unlikely to be controlled — if services get worse, for example, it may have more to do with budget cuts than with any victory, or failure, of citizen monitoring.
Open government data advocates and activists have allies on the inside in a growing number of governmental contexts, from city hall to the White House. But for these allies to be successful, they will need to be able to point to concrete results — sooner and more urgently in the current economic climate than they might have had to do otherwise. This holds a clear lesson for the activists: Small, tangible, steps that turn published government data into cost savings, measurable service improvements, or other concrete goods will “punch above their weight” : not only are they valuable in their own right, but they help favorably disposed civic servants make the case internally for more transparency and disclosure. Beyond aiming for perfection and thinking about the long run, the volunteer community would benefit from seeking low hanging fruit that will prove the concept of open government data and justify further investment.
Everyone wants more information these days even if it’s to be nosey about what is happening to their peers. Even things driving around in a courier van you will get caught on cctv so many times – everyone is watching you which generates data which I guess someone will need at some point in the future.
That’s interesting that the crime data is the most popular, but not surprising. I’ve grabbed that dataset in order to map it for the public already, and probably the building permits will be the next one to use. I usually grab the ones that I think would be most useful to the public to see on a map.
Here’s the resulting public crime map. Note that there is also an open API to grab any chunks of the data for use in other applications.
http://www.yourmapper.com/map/5997ec2a4953d0390742701f6aa128d531fad824/crime-reports/washington-dc-crimes-from-2006-through-now.htm
Some of our datasets and maps come directly from a partnership with local governments through our http://www.GovMapper.com platform services. It makes it easy for them to get their data online quickly. It would be great if city and state governments either put their raw data online like DC has, or use something like GovMapper to get the data public and in a usable format with the ability to export and re-purpose the information.
ok, so let’s say the average person doesn’t care about credit card expenditures – so it doesn’t show up on the graph. But reporters or other information distributors will care and spread it on the news or blogs or whatever – thereby making the information more “bite-sized” and just reporting what is relevant.
Plus it does not matter how many people are looking – only that people are looking. How can that not have an affect on spending? If someone was watching every dime you spent – and was ready to write an article on it – wouldn’t you naturally be more careful with the expenditures?
When you’re talking about new value created, of course, you have to be careful about the “value” created when the government entity stops (or foregoes) providing something at zero or marginal cost that a private entity then provides at higher cost. That’s not so much value creation as a transfer payment.
(1) The downloads appear to be roughly in “gotcha” order.
(2) The lack of downloads of the Construction Completion data may be due in part to its lack of availability in a single file.